Representing data by splines - A method and program to approximate, smooth, interpolate, differentiate, and/or envelope data
The problem
Approximation of data by global methods has some major difficulties. Most of those problems can be overcome if one uses piecewise local polynomials, namely quadratic or cubic splines. They are widely used for interpolation - the extension to approximation is obvious, but it seems almost to be unknown. I have developed a computer program which can be used for various tasks: to approximate more-or-less scattered data, or to smooth, differentiate, interpolate, or calculate an envelope to that data. It seems to be quite flexible and powerful.
Download - program, theory & instruction manual, and supporting files
The theory, practical aspects, the results of several applications of the program, and operating instructions are described in this PDF file. It shows some of the variety of problems that can be solved.
One can download all the files necessary here from this Zip file. There are several example files, which should be unpacked automatically into a sub-directory Examples. For other problems the program can read data from any directory on the computer and outputs results to that same directory.
It might be easier to use the self-extracting Zip file Approximating-splines-program-files.exe, which would unpack the examples files automatically into the sub-directory Examples. However, your computer security might express concerns. Mine did to me when I downloaded and ran the file, but I did convince it to trust me.
Results from program
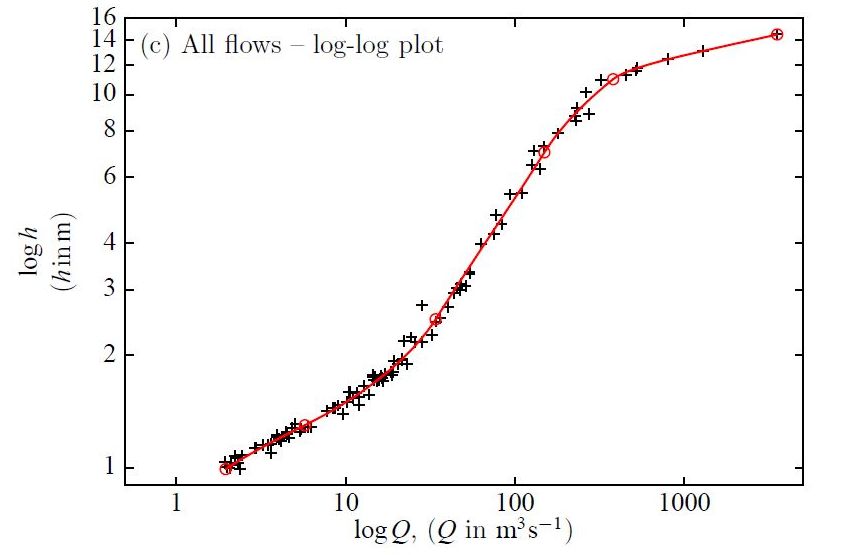
The original problem I wanted to solve was the approximation of rating data from river gauging stations. Here is an example, with roughly 100 data points, from the 10 years of the 1970s for United States Geological Survey Station 02448500 on the Noxubee River near Geiger, Alabama, USA.
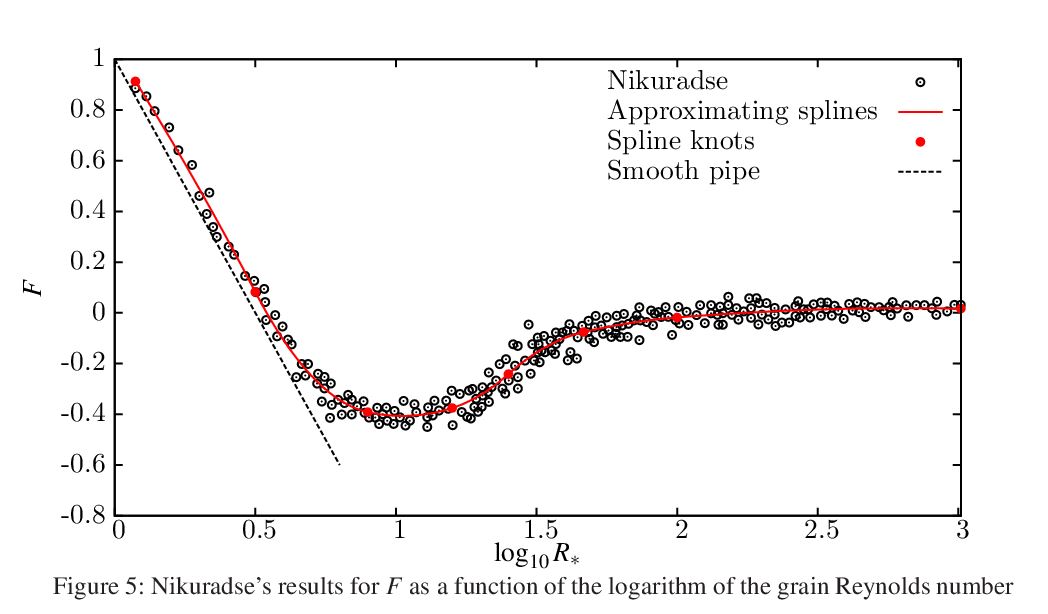
Here is another approximation problem - Nikuradse's
results for the
resistance function F as a function of the
roughness Reynolds number,
independent of relative roughness.
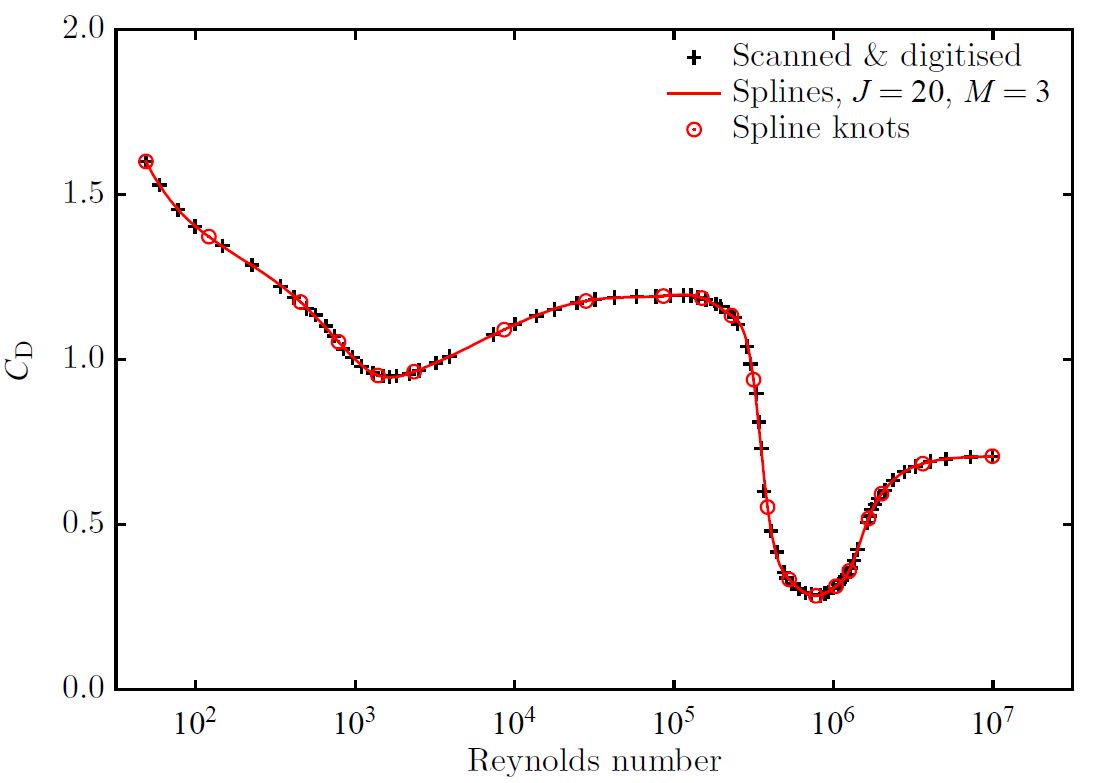
The program might be useful for smoothing operations for plotting and/or differentiation for data which is not all that scattered. I call this quasi-interpolation. A situation might be where one has a set of discrete points that have been digitised or measured by hand, which could have small deviations from a smooth curve for plotting because of the imperfections of the digitising process or using straight lines between data points. As an example, shown on the right, we consider the data set obtained when I scanned and digitised figure 5.11.6 on page 341 of An Introduction to Fluid Dynamics by G. K. Batchelor, for the variation of the drag coefficient of a smooth circular cylinder as a function of Reynolds number. This includes the well-known sudden drop in the coefficient as the boundary layer goes from laminar to turbulent, making interpolation/approximation by global methods very difficult.